
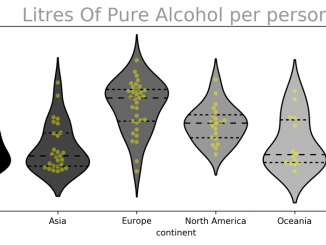
Perfect Plots: Violinplot
Feel free to read the code on GitHub In [1]: import pandas as pd import matplotlib.pyplot as plt import numpy as np import matplotlib.patches as […]
Feel free to read the code on GitHub In [1]: import pandas as pd import matplotlib.pyplot as plt import numpy as np import matplotlib.patches as […]
In [1]: import scipy.cluster.hierarchy as shc import pandas as pd import matplotlib.pyplot as plt # Import Data df = pd.read_csv(’c:/1/USArrests.csv’) USArrests Source of data: https://www.kaggle.com/deepakg/usarrests […]

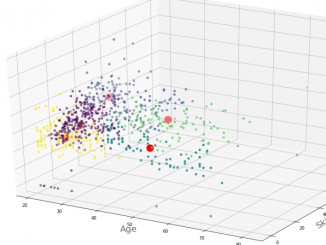
In [1]: import pandas as pd from sklearn.cluster import KMeans import matplotlib.pyplot as plt Wholesale customers data The dataset refers to clients of a wholesale […]
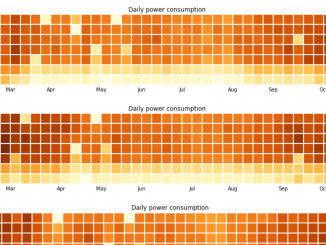
In [1]: import matplotlib as mpl import calmap import pandas as pd import matplotlib.pyplot as plt yahoo In [2]: df = pd.read_csv(’c:/1/yahoo.txt’, parse_dates=[’date’]) df.set_index(’date’, inplace=True) […]
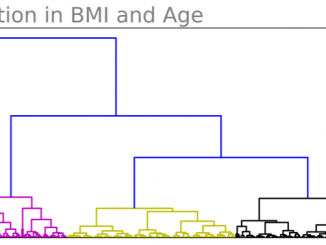
Dendrograms is used to count number of clusters.Dendrogram works on the distance between point of dataframe. In [ ]: import scipy.cluster.hierarchy as shc import pandas as pd […]
Feel free to read the code on GitHub In [1]: import numpy as np import pandas as pd import seaborn as sns from sklearn.preprocessing import […]
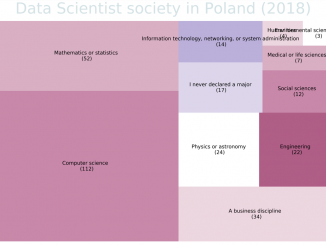
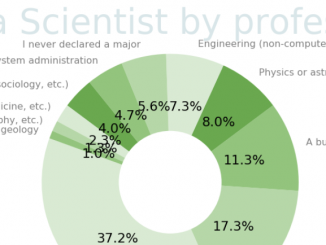
https://www.machinelearningplus.com/plots/top-50-matplotlib-visualizations-the-master-plots-python/ pip install pywaffle In [1]: from pywaffle import Waffle import squarify import pandas as pd import matplotlib.pyplot as plt Car market analysis […]
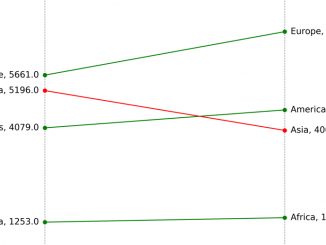
Feel free to read the code on GitHub In [1]: import pandas as pd import matplotlib.pyplot as plt import matplotlib.lines as mlines import numpy […]
An old Chinese proverb says: one picture says more than one thousands words. One good plot can rescue entire presentation. One poor picture can […]
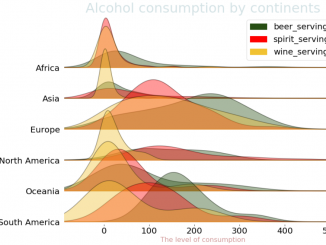
In [1]: import joypy import pandas as pd import matplotlib.pyplot as plt Car market analysis Source of data: https://github.com/selva86/datasets/blob/master/mpg_ggplot2.csv GSuite Text and Background Palette: […]
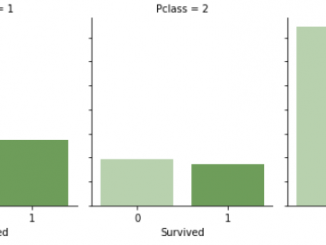
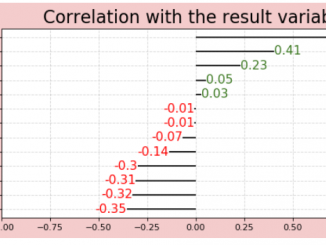
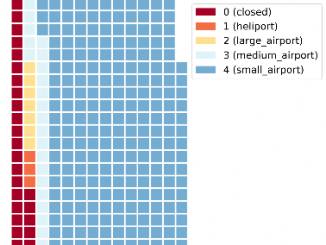
Feel free to read the code on GitHub Analysis of the categorical results. In [1]: import pandas as pd import matplotlib.pyplot as plt import seaborn as […]
An old Chinese proverb says: one picture says more than one thousands words. One good plot can rescue entire presentation. One poor picture can […]

Exercise 29 Naive Bayes Classifier Naiwny Bayes to prosta technika konstruowania klasyfikatorów: modele, które przypisują etykiety klas do wystąpień problemowych, reprezentowane jako […]
Exercise 28 Threshold ROC curve W poprzedniej części stworzyliśmy model, który skazał którzy klienci prawdopodobnie wezmą kredyt oraz tych, którzy niestety, raczej […]
Exercise 27 Marketing bankowy – działalność podmiotów gospodarczych mającą na celu poznanie i dostosowanie się do potrzeb rynku oraz oddziaływanie na popyt […]
Copyright © 2026 | WordPress Theme by MH Themes