
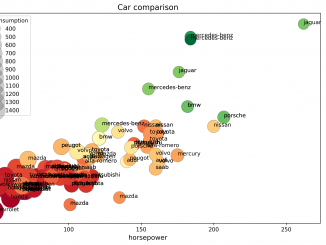
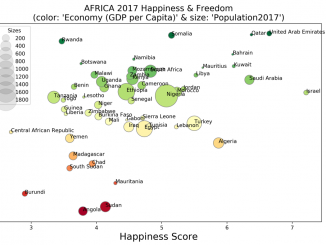
Perfect Plots Bubble Plot
Perfect Plots: Bubble Plot Feel free to read the code on GitHub In [1]: import pandas as pd import matplotlib.pyplot as plt import numpy as […]
Perfect Plots: Bubble Plot Feel free to read the code on GitHub In [1]: import pandas as pd import matplotlib.pyplot as plt import numpy as […]
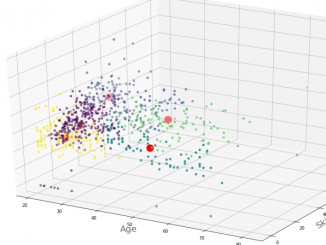
Feel free to read the code on GitHub Source of data: https://archive.ics.uci.edu/ml/datasets/combined+cycle+power+plant Combined Cycle Power Plant Data Set¶ Data Set Information:¶ The dataset contains 9568 […]
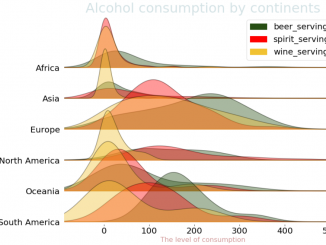
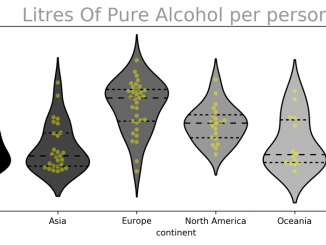
Feel free to read the code on GitHub In [1]: import joypy import pandas as pd import matplotlib.pyplot as plt Car market analysis¶ Source of […]
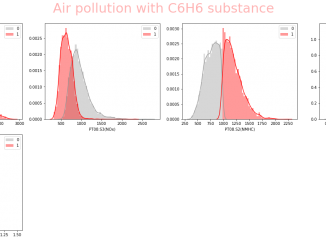
Feel free to read the code on GitHub data source: https://archive.ics.uci.edu/ml/datasets/Air+Quality In [1]: import numpy as np import pandas as pd import seaborn as sns import […]
In [1]: import pandas as pd import matplotlib.pyplot as plt import numpy as np Autos Source of data: https://datahub.io/machine-learning/autos In [2]: df2= pd.read_csv(’c:/1/autos.csv’) df2.head() Out[2]: […]
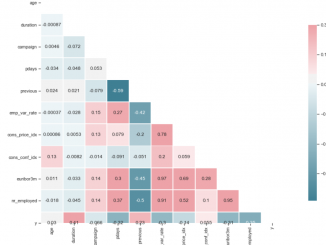
In [1]: import pandas as pd import matplotlib.pyplot as plt import numpy as np Economics In [2]: df=pd.read_csv(’c:/1/economics.txt’) df.head() Out[2]: date pce pop psavert […]
Energy Source of data: https://github.com/pyviz/holoviews/blob/master/examples/assets/energy.csv In [1]: import pandas as pd import matplotlib.pyplot as plt import numpy as np In [2]: df=pd.read_csv(’c:/2/Energy.csv’) df.head() Out[2]: Unnamed: 0 Date […]
In [1]: import pandas as pd import matplotlib.pyplot as plt import numpy as np import matplotlib.patches as mpatches Car statistics In [2]: # Prepare Data […]
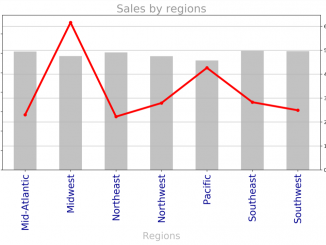
Feel free to read the code on GitHub Global market sales Source of data: https://github.com/vkrit/data-science-class/blob/master/WA_Fn-UseC_-Sales-Win-Loss.csv In [1]: import pandas as pd import matplotlib.pyplot as plt import […]
Feel free to read the code on GitHub In [1]: import pandas as pd import matplotlib.pyplot as plt import numpy as np import matplotlib.patches as […]
In [1]: import scipy.cluster.hierarchy as shc import pandas as pd import matplotlib.pyplot as plt # Import Data df = pd.read_csv(’c:/1/USArrests.csv’) USArrests Source of data: https://www.kaggle.com/deepakg/usarrests […]
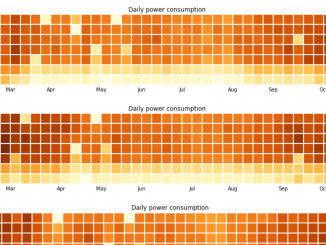
In [1]: import matplotlib as mpl import calmap import pandas as pd import matplotlib.pyplot as plt yahoo In [2]: df = pd.read_csv(’c:/1/yahoo.txt’, parse_dates=[’date’]) df.set_index(’date’, inplace=True) […]
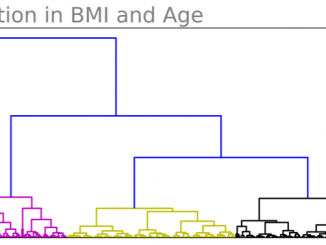
Dendrograms is used to count number of clusters.Dendrogram works on the distance between point of dataframe. In [ ]: import scipy.cluster.hierarchy as shc import pandas as pd […]
Feel free to read the code on GitHub In [1]: import numpy as np import pandas as pd import seaborn as sns from sklearn.preprocessing import […]
https://www.machinelearningplus.com/plots/top-50-matplotlib-visualizations-the-master-plots-python/ pip install pywaffle In [1]: from pywaffle import Waffle import squarify import pandas as pd import matplotlib.pyplot as plt Car market analysis […]
Copyright © 2026 | WordPress Theme by MH Themes